Atlas of Electronic Music
The idea for this project stemmed from wanting to do something with the spotify API and to make a network visualisation having seen some really nice ones recently (see here for an example). The main inspiration for this idea came from this similar visualisation, focusing on the metal genre. A couple of other posts that helped inform my methodology can be found here and also here. I had not seen this idea applied to electronic music however, so I thought it would be a good excuse to make a few network graphs.

Data
The methodology for gathering and cleaning the data was based on the posts linked above, particularly the second one.
The data gathering process was rather iterative and required quite a bit of manual effort. I started by creating a list of various electronic artists from different subgenres and then finding each of their related artists using the spotipy library in python. This gave me a longer list of artists and I then searched for the related artists of artists on this list and so on for a few more iterations.
The downside of this method was that it often pulled through artists that were not electronic but from literally every other genre - so I had to manually search through and filter our certain genre tags and specific artists. However, sometimes filtering out genres would exclude actual electronic artists, so I had to make sure they were included as well. This ended up being rather time consuming, but also allowed me to discover some interesting genres and artists to listen to in the future. I also filtered out artists with less than 10,000 spotify followers and those with no genre tags, which may have biased the dataset slightly but also prevented too much noise in the visualisations. After creating a few initial networks using this approach, I went back and added more artists to the initial artist list to bolster some subgenres that I thought were under-represented (e.g. synthpop, EBM) and reran the process.
One major issue with using Spotify data is it only represents what Spotify’s users listen to and of course only has listening data from at most the last 16 years (Spotify was founded in 2006). Additionally, some artists’ discographies are not available on Spotify. Because of this, a lot of artists who were at one time popular and are regarded as important in the history of electronic music are not represented very well in the dataset e.g. Klaus Schulze, Karlheinz Stockhausen, Derrick May, Juan Atkins. So this project would be better titled “Atlas of electronic music - according to Spotify”.
Visualisation
The data was visualised using Gephi. I used a type of graph called a force-directed-graph, employing the ForceAtlas 2 algorithm. To add a splash of colour to the visualisation I used a community detection algorithm. This works by dividing the network into “modularity classes” - groups that generally have denser connections to nodes within the same modularity class than to nodes within other classes. Each colour in the network represents a different modularity class.
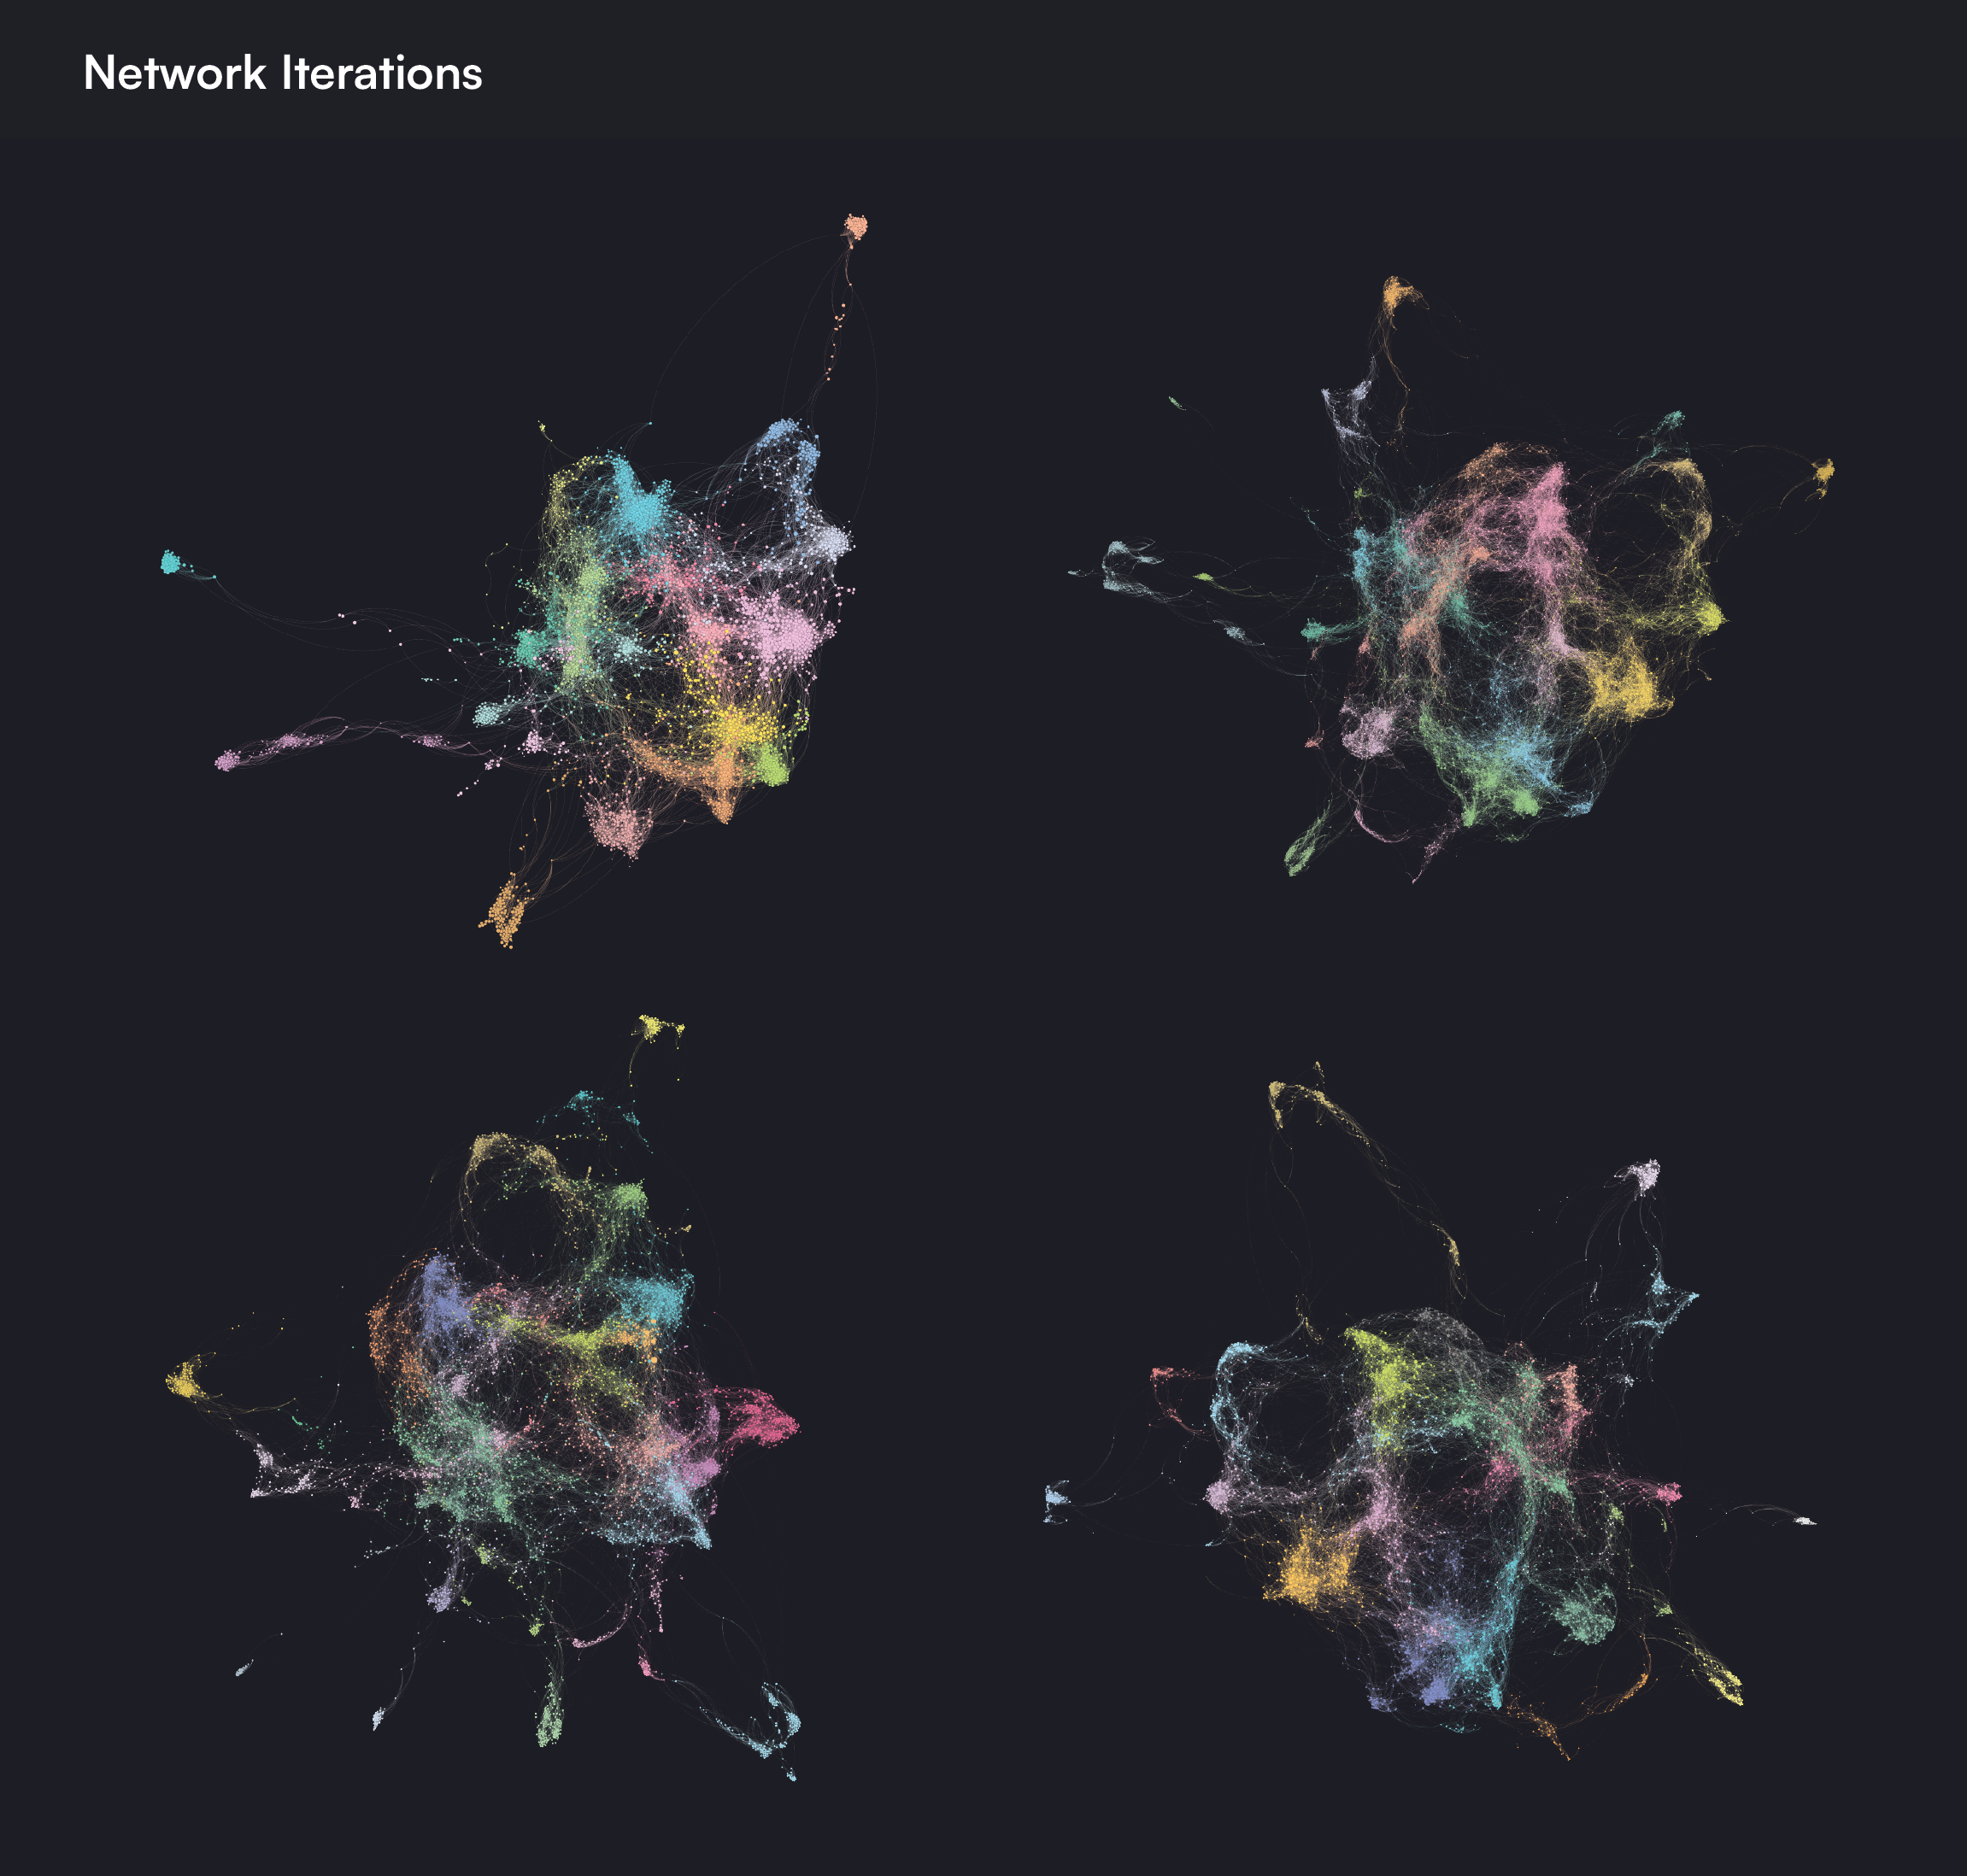
I labelled each of the modularity class groups based on their overarching genres. Some groups were easy to define, being comprised of basically one genre (e.g. hardstyle, lofi, psytrance), however others were a bit more nebulous. For instance, the “experimental” group is made up of a variety of different subgenres like ambient, future garage and classic dubstep - however the artists within these subgenres could broadly be defined as experimental. Some artists were also a bit out of place, e.g. EDM artists in the dubstep group. These were mostly “fringe” artists that join multiple groups together by the other artists they are related to, so it’s not really a big issue, but it is true that the sub-genre labels are not precisely correct, and are instead more-so generalisations. Part of the reason for this may be due to the “playlist culture” of spotify which has possibly made a clear genre classification of music somewhat redundant - as it instead allows people to group music in ways beyond a standard genre taxonomy.
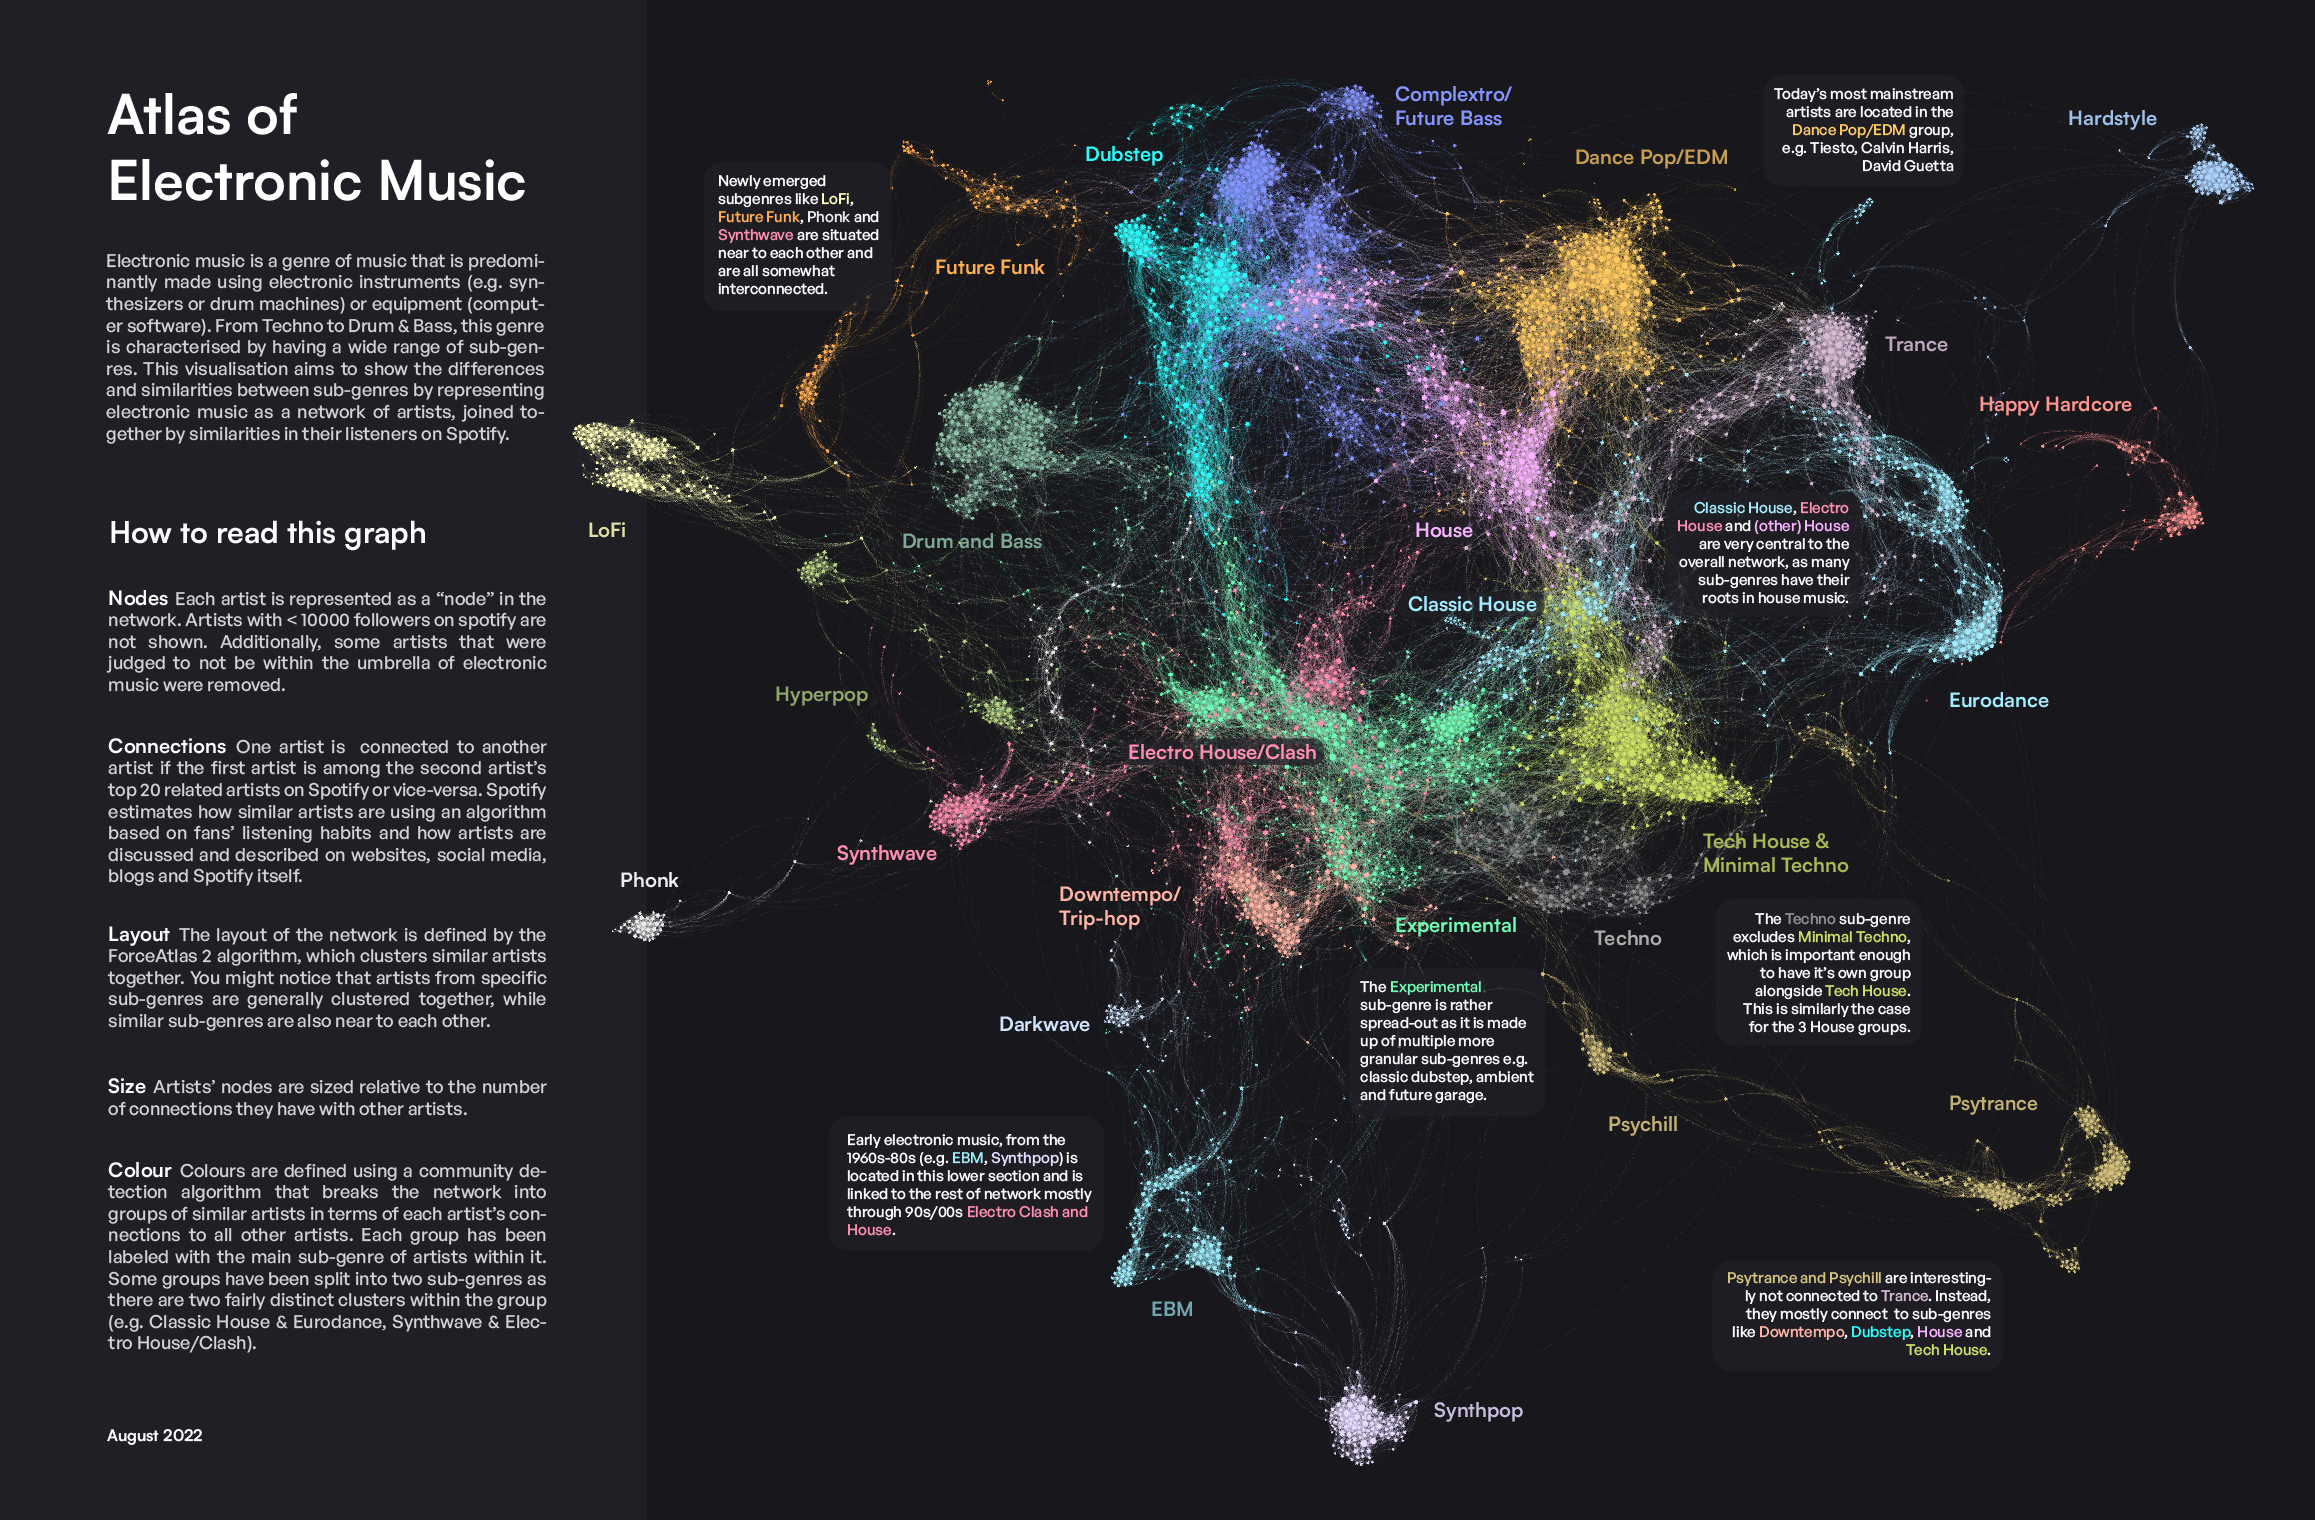
The network went through a number of different versions (see above) but I eventually ended up with a pretty good dataset and network (I think) - including just over 5000 artists.
See the end product below:
Final Thoughts
This visualisation took quite a while to make, with a lot of back and forth required before I was happy with it, and while it’s not a perfect representation of the universe of electronic music, I think it still turned out pretty well.